Have you ever been in a meeting in which your school is trying to decide if they should implement a new form or technology? If so, then this article, Emerging Educational Institutional Decision Making Matrix by Ashford-Rowe and Holt (2011), might interest you. The matrix that they have developed allows educational institutions to use a flow chart to add rigor and consistency to the decision making process prior to implementation of new technology. The matrix allows educational leaders to look at new innovations based on pedagogy rather than technological imperatives. The matrix is designed as a flowchart that leads the user down a series of choices. Having this tool at hand allows for adaptation of new technology into the classroom, or even on a larger scale such as an entire school district, to follow an objective process rather than a quick, biased subjective one.
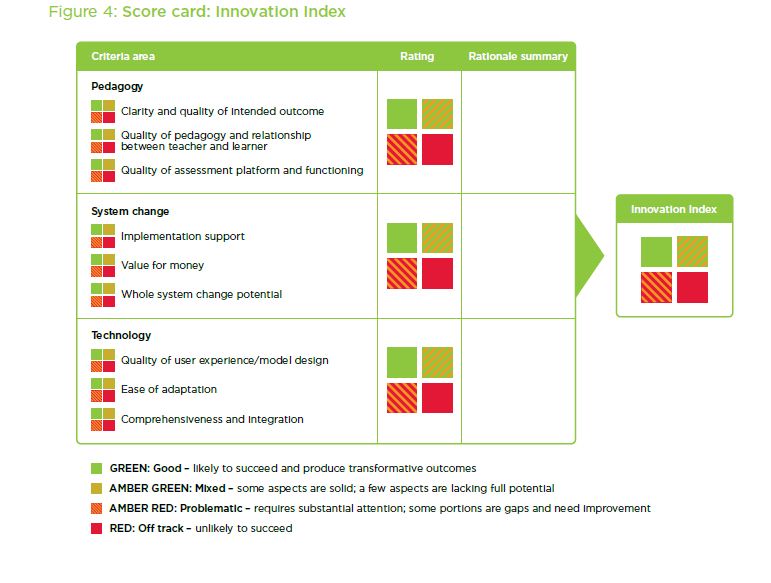
The rationale behind creating this decision making procedure was to insure that any technology that was being brought into an institution would match the needs of its learners, their technological readiness and would be considered good educational practices. As Fullan and Donnelly discuss in Alive in the Swamp, we are constantly being bombarded with new innovations and decisions need to be made to bring in the best technology that will be transformational to the education system (Fullan and Donnelly, 2013). Fullan and Donnelly developed an innovation score chart that uses a color code of green, amber and red to evaluate new technologies. Here, Ashford- Rowe and Holt have simplified the process by creating a streamlined flow chart. Although both group of authors agree that the new technology needs to have a strong pedagogy that matches the students’ needs prior to implementation, the model that Ashford-Rowe and Holt use to represent their choices vary slightly.
Not only is a strong pedagogy necessary prior to implementation, but cost must also be taken into consideration. Because technology is changing so rapidly and in such a short timeframe, institutions must make sure that money spent will reap a great reward. Cost is not solely money spent. It can also represent the man hours used to install, maintain and train individuals to use new technologies. As budgets are forever tightening and being scrutinized, institutional leaders are more wary at spending money on an item that might quickly become outdated. In both financial and human resources terms, this means that implementing new technologies carry a greater risk.
The Griffith University Matrix consists of five different stages: initial development, trial and initial evaluation, initial collaboration, implementation and final roll-out. At each step, the user is asked if the process is worth continuing or trialing. If the answer is yes, the process continues further down the chart. If the answer is no, then the following options are available: shelve the technology, put the project on hold until the technology matures in the market or test the product further. Although this matrix was designed to use at a post-secondary institution, I can see it being adapted to use in any K-12 setting.
For myself, I like how this article echoed the same guiding principles for implementing technology as was seen in Alive in the Swamp. However, I found this matrix much simpler to follow than the color coded system created by Fullan and Donnelly. Both articles emphasized that technology is rapidly changing and the education system is constantly making decisions at which tools to implement. If education is meant to be engaging and relevant while implementing technology, a matrix such as the one presented here, will greatly insure that time, money and pedagogy are benefiting.

Image taken from appendix B of http://files.eric.ed.gov/fulltext/ED519570.pdf
Sources:
Donnelly, K., & Fullan, M. (2013, July). Alive in the Swamp: Assessing digital innovations in education. Retrieved January 23, 2016, from http://www.nesta.org.uk/publications/alive-swamp-assessing-digital-innovations-education
http://files.eric.ed.gov/fulltext/ED519570.pdf
Donnelly, K., & Fullan, M. (2013, July). Alive in the Swamp: Assessing digital innovations in education. Retrieved January 23, 2016, from http://www.nesta.org.uk/publications/alive-swamp-assessing-digital-innovations-education
http://files.eric.ed.gov/fulltext/ED519570.pdf